Formulas, citations and presenting
Math, diagrams, code and calculations
LaTeX formulas, Mermaid diagrams and code blocks with highlighting, calculating right in the text and figures from databases.
9 min read
Formulas, diagrams and code
- Formulas in LaTeX: as a block with
/math, inside the text with/inlinemath. The preview appears while you type. Building blocks such as fraction, root, superscript, subscript, vector, cross product, ±, π and sum sit above the input. - Mermaid diagrams: a click or Enter opens the source and preview. Up to 20,000 characters and 500 edges. In dark mode Mermaid diagrams are drawn dark, and redrawn when you switch; downloads (SVG/PNG) and printouts stay light.
- draw.io diagrams (
/drawio): open the draw.io editor in a large window; Save applies the diagram as one step you can undo. A double-click, Enter or the pencil on the block opens it again. Flowplan stores the drawing and a picture of it: when viewing – on shared pages, in presentations and offline too – it doesn't load draw.io at all and only shows the picture (cleaned, without scripts and without content from elsewhere). Drawing and picture may each be up to 800 kB.- Maximize: the arrows button at the top right of the window (next to the close button) enlarges draw.io to the whole browser window; the same button (Restore size) brings the window back. It works from the keyboard too. The diagram stays open and unsaved changes are not lost; Esc and Close ask before discarding changes as before. The device remembers the choice: the next diagram opens the way you left the last one. On a phone draw.io fills the screen anyway (keeping clear of the notch and the home indicator), so there is no button there.
- A page for one diagram: the Diagram page template (under Templates, category Knowledge & documentation) creates a full-width page with one empty draw.io diagram and opens draw.io right away. On a full-width page the saved picture uses the whole width, and an empty diagram is a large area rather than a thin strip. There is no separate page type for this as there is for whiteboards – the diagram page is a document, so you can add text, more diagrams or other blocks.
- Where draw.io runs: by default Flowplan uses
embed.diagrams.net. While you draw, the diagram's content goes to that service; the window says so. WithDRAWIO_URLthe instance points to its own draw.io (for example thejgraph/drawiocontainer), and everything stays with you (see Configuration). - Look: under Settings → Appearance → Editor: draw.io theme Automatic (follows Flowplan), Light or Dark, and draw.io interface Default, Minimal or Sketch. The choice applies to this device.
- Export: in the ZIP export every diagram becomes a
.drawio.svgfile that draw.io can open again; in a single Markdown file and in the Git export it is a```drawioblock with the drawing, which the import turns back into a diagram (the picture is made the next time it is saved). PDF and EPUB show the picture.
- Code blocks: the language is shown in the block's header with its full name ("JavaScript", "C++", "Angular TypeScript", "Plain text"). A click opens a list with a search – it finds names, aliases and file extensions (
ts,py,yml,tf,.rs…). The languages you chose last come first (remembered in this browser). There are more than 240 languages with the same grammars as in VS Code – among them Svelte, Vue, Astro, JSX/TSX, Terraform, TOML, Typst, Zig, Prisma, GDScript, Nushell, systemd units, SSH config, Git commit messages, log files, CSV/TSV and .env files. Line wrap and Copy are at hand. Tab indents by two spaces. - Language detection: when you paste code into a block without a language (plain text), Flowplan suggests a language if it is clearly recognisable – "Looks like Python – set?". One click sets it, the × dismisses the suggestion. Flowplan never changes the language by itself.
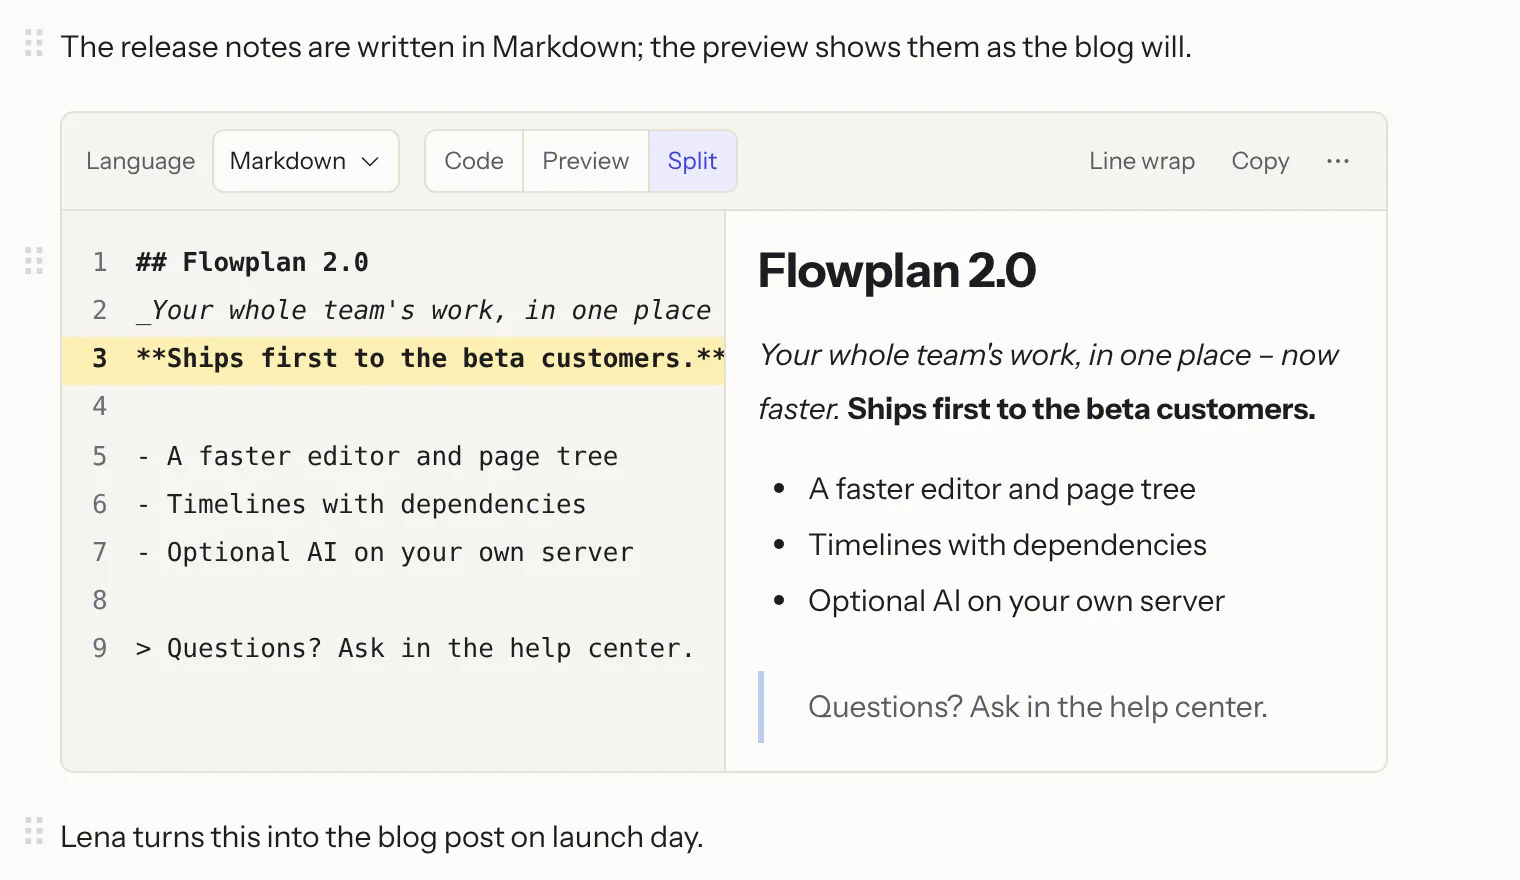
- Preview: code blocks in HTML, SVG (language XML with
<svg>), Markdown, Mermaid, LaTeX and Typst show the switch Code / Preview / Split in their header. Split puts code and preview side by side, on a phone one below the other. The view is stored in the block; people who only read a page (read access, published pages, presentations) see the preview unless the block says otherwise, and can switch for themselves without changing anything. Errors (such as a typo in the diagram or in Typst, with the line number) show in place of the preview.- HTML runs in a sealed frame: no scripts, no forms, no access to Flowplan or the network. Pictures from the web stay blank; embedded pictures (
data:) and styles work. The height follows the content. - SVG, Mermaid and Typst show as a picture – without scripts or links.
- Markdown is converted as on import, LaTeX shows formulas with KaTeX (separated by blank lines, with or without
$$ … $$; not whole LaTeX documents with\documentclass). - Typst loads the first time it is used (a few MB, from your own server, not from the web); Typst packages (
@preview/…) and files are not available. - New Mermaid code blocks (
```mermaidor the language Mermaid chosen) show the diagram right away, empty ones code and diagram side by side. The separate Mermaid block (/mermaid) stays.
- HTML runs in a sealed frame: no scripts, no forms, no access to Flowplan or the network. Pictures from the web stay blank; embedded pictures (
- Line numbers: the … menu in a code block's header turns Line numbers on or off for that block, sets the First line number (say 10 for an excerpt) and highlights lines – e.g.
3-5, 8, counted as shown. The numbers cannot be selected and are not copied; with line wrap they stand at the first row of a wrapped line. Blocks without a setting of their own follow Settings → Appearance & language → Editor → Show line numbers by default (on this device). - Collapse: code blocks with more than 25 lines appear collapsed – 10 lines high, scrolling inside, faded at the bottom. Show all N lines expands them, Collapse folds them again (both reachable by keyboard). People who may edit store the state in the block; readers only expand for themselves. The … menu sets Collapsed and the Collapsed height (5, 10, 15, 20 or 30 lines). Printing and every export always show the whole code.
- A language's highlighting loads with the first code block of that language; until then the code shows briefly without colours. Very long code blocks (more than 50,000 characters) stay without highlighting.
- Fractions:
/Fraction(or/Bruch) inserts a formula inside the sentence.
Calculating in text
Flowplan only calculates when you want it to – exactly, with fractions, in German or English notation (2,5 or 2.5, ×, ², √, €):
- Hint after "=": type a calculation followed by
=, such as12 × 2,400 € =or3/4 + 1/6 =, and the result appears greyed out behind it. Tab accepts it, Esc or typing on dismisses it. - Selected text: select a calculation, a term or an equation; the text menu (also on right-click) shows what is possible under Calculate and inserts the result after it with one click:
- Result and Reduce as an exact fraction, plus As a decimal –
12/18 = 2/3 - Expand, including the binomial formulas –
(a + b)² = a² + 2ab + b² - Factor –
x² − 9 = (x − 3)(x + 3),4x² − 12x + 9 = (2x − 3)²,6x² + 9x = 3x(2x + 3), also with several variables:a³ − b³ = (a − b)(a² + ab + b²),x² + 2xy + y² − 1 = (x + y − 1)(x + y + 1), by groupingax + ay + bx + by = (x + y)(a + b); Factor with roots splits further into real factors:x² − 2 = (x − √2)(x + √2) - Simplify algebraic fractions –
(x² − 1)/(x − 1) = x + 1,1/x + 1/(x + 1) = (2x + 1)/(x(x + 1)) - Solve for x – linear and quadratic equations exactly (
x² + 2x − 4 = 0 ⇒ x = −1 ± √5), higher degrees exactly where possible (x³ = 2 ⇒ x = ∛2,x⁴ − 5x² + 6 = 0 ⇒ x = ±√2, ±√3), otherwise as rounded decimals (x³ + x − 1 = 0 ⇒ x ≈ 0.682328); with several variables, for each one that appears linearly. Equations with x in a denominator are solved with the common denominator; values that would make a denominator 0 are excluded and named (x/(x − 1) = 1/(x − 1) ⇒ no solution (x = 1 excluded)). - Copy result: the button at the end of each result row copies the result as shown (such as
y² − 16y + 64) to the clipboard as plain text – for pasting into other apps. Clicking the row itself still inserts it after the selection.
- Result and Reduce as an exact fraction, plus As a decimal –
- Function graph: select a term in x, such as
x² − 2orf(x) = 2x + 1, and choose Draw graph in the text menu – a graph with axes, grid and marked zeros appears below./Function graphinserts one too. The functions are edited below the graph: it changes while you type, + Function adds up to six functions in their own colours (sin(x),cos,tan,exp,ln,abs,√andπwork). Dragging moves the view, +/− or ⌘/Ctrl + scrolling zoom, ⟲ resets the view. On published pages the graph can be moved and zoomed but not changed. - Vectors: write vectors as
(1 | 2 | 3),(1; 2; 3)or(1, 2, 3). Flowplan calculates sums and multiples (2 · (1; −2) − (3; 1) = (−1; −5)), the dot product with·including the angle ((1, 0) · (0, 1) = 0 ⇒ ∠ = 90°), the cross product with×((1|0|0) × (0|1|0) = (0 | 0 | 1)) and the magnitude with|…|(|(1, 1)| = √2). A vector selected on its own shows its magnitude and unit vector ((3, 4) ⇒ v⁰ = (3/5, 4/5)). Draw vectors in the text menu shows vectors in the plane as arrows in a coordinate system – for(1, 2) + (3, 1)both vectors and their sum. More vectors such as(3, 2)can be entered in the graph next to functions. Vectors in space such as(1, 2, 3)– cross products too – are drawn in a 3D coordinate system with x, y and z axes, a floor grid and dashed guides to the floor; dragging turns the view, and the view is saved with the page. The formula editor has the building blocks Vector (column vector), Vector arrow and Cross product; column vectors in formulas are calculated the same way. - In formulas: the formula editor shows the same options under Calculate and appends the result in LaTeX, such as
\frac{3}{4} + \frac{1}{6} = \frac{11}{12}.
Dashboards and metrics
/Metric inserts a card with a number from a database, /Dashboard three side by side. With the gear you choose:
- the database (every database in the workspace you can read),
- optionally a view – then only the records its filters show count, such as “Open tickets”,
- the calculation: number of records, sum, average, minimum or maximum of a number, formula or rollup property,
- a label.
The server calculates the number for the person looking at the page and refreshes it every minute; private records only count for people allowed to see them. On published pages, visitors without access see a dash. Add charts by inserting a linked database below the metrics and choosing a chart view there – that makes a dashboard from several databases.